And what did this sewist do? Installed some nifty sewing apps, of course! And one of them was Cora.
Now, if you don't know Cora, it is most likely because you have Android on your phone. Me too. And Cora only works for iTunes/AppStore/Apple products. Like the iPad 2. Aha!
It is a fabric stashing app, where you can catalog your fabric and then browse through or search it. You can filter your stash by type, weight, wash status, star-markings or by the minimum length your next project will need. The fabrics are beautifully displayed and a long tap on the picture will show the photo in full size while a short tap will show all the details you cataloged it with, including type, fiber content, location, design, length, price, source, colors, wash status and more.
Now, I quickly got addicted to the Cora app. It does cost money to get past the first 5 fabrics added, but it has been worth every penny so far. And 251 fabrics later, I still love it!
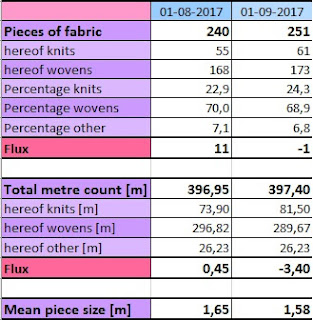
It does have 1 little drawback, though. It will tell you just how much fabric you've REALLY got. And it told me that I got a total of 400 meters! Yikes!
At this point, I was halfway in denial. How the h*** do I have 400 meters of fabric?!!! Then, a week later, when the hard truth had settled in, I made a plan.
I will sew up, give away, sell or discard enough fabric, so that I reduce my stash to a total of 300 meters by September 1st, 2018.
And then I went crazy in Microsoft Excell. I have charts and graphs for everything now, stash size, type, and color distribution and spreads just for planning makes and blog posts.
Let me show you :)
Above - stash data taken directly from the Cora app is put in and processed to give a net flux for each month as well as a total for the time period until Doomsday, aka Sep 1st, 2018.
Above - A stash size in meters over time plot with the pink being total, blue being wovens, purple being knits and light pink being others. The points at February and June shows "stash size goals".
Above - Fabric type distribution in stacked percentages. Purple is wovens, pink is knits and blue is others. I have no end goal for this one, I just thought it could be interesting to see. My mother has roughly the reverse distribution of knits and woven than me, for instance.
Above - Color distribution. I didn't know I had so much blue?
Above - A chart of finished make by garment type and recipient. The chart calculates a "selfish rate" that I'd like to keep around the 85-90% as well as a make count for the entire period for each garment type. Joost is the name of my boyfriend, BTW.
Above - 2 graphs to visualize the makes chart. I love to see them grow as I type in my latest make.
And lastly, my Makes Planner. The dark pink makes are finished. Light pink ones have been cut out and/or is in progress. White ones are only temporary plans. I love how I can move the cells around as plans change, and how I can see ahead to upcoming projects. It makes pre-washing fabric and buying notions so much easier to do in advance.
I do find that having the Cora app and keeping detailed statistics keeps me more focused and thus more productive in my sewing. I get a little "kick" every time I get to downsize or delete a fabric, change the color of a cell in the Makes Planner and so forth. I am having way too much fun, people!
So, for now, I will keep the statistics going. I will return on September 1st, 2018 with more statistics, showing you how it all went. Wish me luck!


That app looks fantastic! And I love the idea of charting everything in Excel. My system is comparatively low tech - I upload an image and description to OneNote.
ReplyDeleteWell frak -- this app sounds awesome. Too bad I'm an android gal :(
ReplyDeleteBut all of this charts and graphs are right up my alley!